Menu
The function and support options are subdivided into six main menus, which can be found in the top menu.
The first is file, and the functions related to this menu are mentioned in the document usage instructions.
The next three: Edit, View and Arrange are all related to using graphs. The last two are Extras and help.
Tools Bar
Right below the menu bar is the toolbar. Many of the most commonly used view and edit options can be accessed from this column.
sidebar
Left is Sidebar。
Clicking an icon causes an instance of the icon to appear in the upper left corner of the chart.
Clicking and dragging the symbol allows you to position the symbol anywhere in the work area.
The first library displayed is the universal library, which is located at the top and should have been opened.
Each tab under’ General’ corresponds to a different library.
Clicking any tab will display the symbol for the library.
scratchpad can drag icons into it as commonly used icons for next use.
Control Panel
Located on the right panel, it manages and edits various functions.
查看选项
Click View ,Menus provide us with many ways to customize user views.

Format Panel
Select Open and Close the Format Panel on the right. This function is also available on the toolbar.
Outline
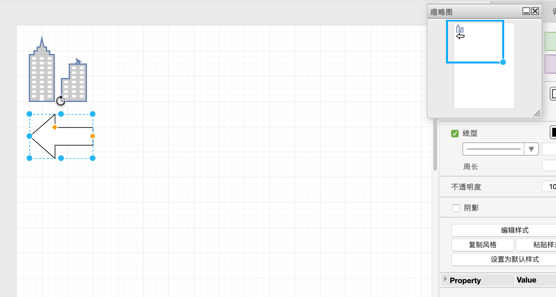
The invention provides a useful method for displaying through large and complex charts.
Selecting this option will cause the thumbnail to appear.
Clicking and dragging the mini page displayed in the thumbnail panel also moves the home page.
The mini-page section contained in the blue frame corresponds to what you see on the home page.
This function is also available on the toolbar.
Similarly, you can right-click and drag the home page and observe the changes in the Outliner.

Layer
Shows the hierarchy of different icons in the page, which is also provided on the toolbar
Page View
By default, the workspace is displayed in Page View; Its size depends on the choice of paper size. Unchecking this box will cause the workspace to fill the entire window. This option can also be toggled in the Format Panel.
ScrollBar
By default, vertical and horizontal scroll bars appear next to the chart workspace.
Disabling this option will delete the scroll bar.
You can still move in a large picture without scroll bars by right-clicking and dragging, or by navigating through the Outline Window.
Tooltip
Comments attached to a specific chart element can be inserted by selecting edit-> edit tooltip and typing the required information. Disable this option if you do not want to display tooltips. Please note that this will only disable comments you added yourself. Tooltips for drawings that already exist will still be displayed.
Grid:
By default, the work area displays a point grid to help align the symbols. Toggle this check box to turn the grid on and off. To the right of the grid scale box is the snap grid size selection. The default is 10 pounds. This determines the shape or spacing at which the connectors are aligned with the grid lines. For example, increasing this number to 100 pounds would mean that the shapes and connectors would only be placed at greater intervals. Reducing this number again will allow you to place shapes more accurately. This option can also be switched in the format panel
Guide
By default, guides are automatically displayed whenever the center axis or edge is aligned with another nearby shape when moving symbols around the work area. This is to make it easier for symbols to align with each other. In the following example, the user is dragging a rectangle; Its edge is currently aligned with the center axis of another rectangle.

Toggle this check box to open and close the wizard. This option can also be switched in the format panel.
Connection point:
By default, hovering over a symbol displays the connection point of the symbol (see figure below), making it easier to connect the connector to the symbol. Toggle this check box to turn this function on and off. This option can also be toggled in the format panel.

Zoom in
Click view -> zoom in to zoom in to your chart. Click multiple times for high magnification. This function is also available on the toolbar.
Zoom out
Click view -> zoom out to zoom in to your chart. Click multiple times for high magnification. This function is also available on the toolbar.