On the left is a number of library of charts from which you can select shapes to build charts. We will use the General library. If it is not open, click anywhere on the General tab to open it and display the symbol.

Click and hold the rectangular shape (the shape in the upper left corner), drag it to a position on the chart, and then release. The shape will appear in your chart, highlighted.

With nothing selected in the chart, hover over the rectangle. There will be many crosses and four blue arrows. These are fixed connection points that you can use to place connectors. Click the connection point and drag the mouse. A green line will appear.

When you have determined the end position of the connection, releasing the mouse will create a connection and a copy of the original rectangle connected to the other end.

The replica was created because we enabled the copy on connection option. However, sometimes we want to use different symbols, which is not convenient.
Go to the menu bar again and select other -> copy when disconnecting to disable this function.
We will now create another connection, but this time it will connect to a different shape.
Hover the mouse over the second rectangle, select a connection point, and then click and drag as before.
We select a point to terminate the connector and release the mouse.

When we released the mouse this time, we created the connection, but no shape appeared with it.
This allows us to choose any available shape.
When highlighted, you may have noticed a blue arrow symbol to the right of each shape.
Clicking this button will automatically generate a copy of the shape, located to the right of the original shape and connected to it.
This is similar to the process we went through when we created the second rectangle using the Copy on Connection option, except that this method works even if the Copy on Connection option is disabled.
However, there is one difference: using arrow symbols to copy and connect creates floating connections at both ends.
Copying on Connect will result in a floating connection to the new shape, but will result in an anchored connection to the original shape.
We may decide not to put the second diamond in the drawing place.
Now that we have highlighted the shape, let `s drag it to other places.
We have pulled the second diamond up from its original position, but we have not released it yet.
The information provided when we move the shape can help us put it where we want to put it.

First, we see a dashed outline showing where the shape will go if we release it to its current position.
It also provides the current coordinates of the location, taken from the upper left corner of the shape.
Sometimes we see blue guidelines appear.
These tell us that the edge or central axis of a shape is aligned with the edge or central axis of another nearby shape.
In the above example, we can see that our current position is aligned with two shapes, one vertical and one horizontal.
Let’s put the shape here and click once away from the shape so that it is no longer highlighted.
The shape appears in its new position and the connector changes its route to keep the connection.
Now it is connected to a point at the bottom of the diamond. For any floating connection, this is handled automatically by the system.
Let `s move the second diamond again, this time directly under the first diamond.
We will know when they are aligned because a blue vertical guide line will appear.
Now release the mouse. The diamond has moved again. This time, the floating connector has moved its position at both ends.

Sometimes we want to change the connections in the diagram.
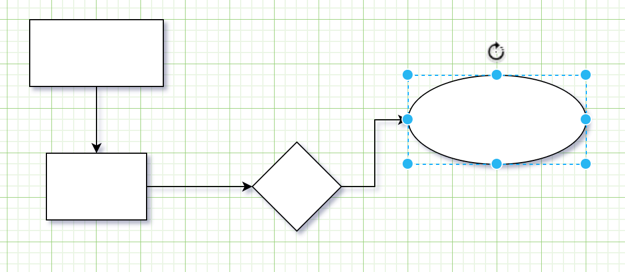
Perhaps we have decided that the connection with the second diamond needs to be changed to another shape. First, drag an ellipse from the General Symbol menu onto our chart.

Now we want to move the arrow end of the connector to connect it to the ellipse. At this moment it is connected to the diamond and will move with the diamond. To move it, we first highlight the connector and then place the cursor on the connector arrow.

Now click the arrow and drag it onto the ellipse. We want to connect and anchor the connector to a point on the ellipse, so we need to find a connection point around the ellipse.
Connection points usually surround a shape at regular intervals, usually where the axis of symmetry intersects the perimeter.
We will know when to drag the connector onto a connection point of the ellipse, because all the connection points of the ellipse will appear, and the connection point on which you are currently hovering will be surrounded by a small green square, which indicates that the connector is correctly placed to connect to the point.
Releasing the connector connects and secures it to the ellipse. If you move the ellipse, the connector will follow it.

Let `s complete the first tutorial by adding some text to the chart. The easiest way to add text is to double-click where you want the text to appear. Clicking and typing inside the shape or on the connector will cause text to appear in the center of the shape.

If we want to add text to the shape, just place the cursor where we want the text to appear and double click. A text box will appear in which we can simply enter.