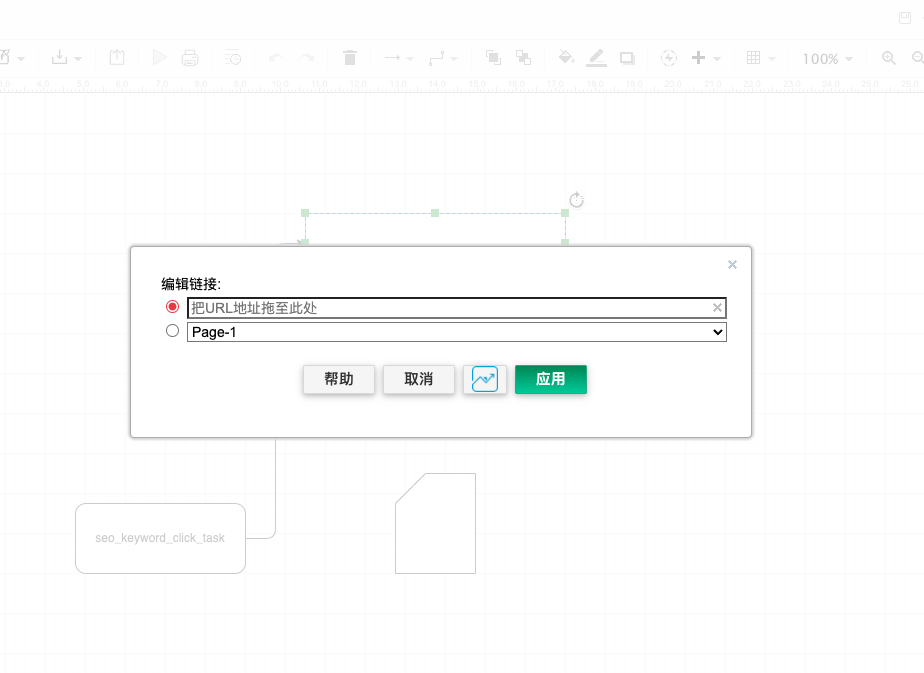
Custom links can be used where hyperlinks and links to pages are allowed, namely on shapes and (parts of) text labels.
Add a custom link
Right-click on a shape, then select Edit Link, or select the shape and use the keyboard shortcut Alt+Shift+L.
Enter the custom link in the first text field.

Formatting custom links in freedgo.com
The format for custom links is: data:action/json,{“actions”:[actions]} where actions is a comma-separated list of JavaScript objects (JSON) with the following possible keys:
- “open”: string - opens a standard or custom link (including page links).
- “toggle”/“show”/“hide”/“highlight”: cellset - toggles, shows, hides or highlights the given diagram elements.
- “select”: cellset - selects the given cells if the diagram is editable.
- “scroll”: cellset - scrolls to the first cell in the given celllset.
- “viewbox”: {“x”: int, “y”: int, “width”: int, “height”: int}.
If no scroll action is specified, then the first shape or layer listed in the select or highlight action is scrolled to be visible (select has precedence) when you click on the link.
For highlight, you can specify a color (string), duration (number in milliseconds) and opacity (1-100).
A cellset is an array of shape and layer IDs, or tags, or both, e.g. {“cells”: [“id1”, “id2”], “tags”: [“tag1”, “tag2”]}.
- If multiple tags are used, then the diagram elements that have all of the tags are selected (AND).
- To toggle cells with either tag1 or tag2, use multiple toggle actions instead.
- To specify all cells, use “cells”: [“*”].
- To specify all cells with a tag, use “tags”: [] (an empty array).
Note that when you use tags to toggle diagram elements, it will change the current visible state of those diagram elements.
Example 1
This shows or hides the cells with ID 5 and ID 7, depending on their current visible state. See this example in diagrams.net.data:action/json,{"actions":[{"toggle": {"cells": ["5", "7"]}}]}
Example 2
data:action/json,{"actions":[{"open": "data:page/id,1"},{"highlight":{"cells":["2"],"opacity":100, "color": "red"}}]} |
This opens the page with ID 1 and then highlights the cell with ID 2 in red with an opacity of 100%. [See this example in diagrams.net](
Example 3
data:action/json,{"actions":[{"show": {"tags": []}},{"hide": {"tags": ["pipe", "water"]}}]} |
This shows all cells with a tag and then hides all cells with the tags pipe and water.
Find the ID of a shape, page, or layer
Shape: Right-click on a shape, select Edit Data, or select a shape then use the keyboard shortcut Ctrl+M on Windows or Cmd+M on macOS.
Edit Data on a shape or a page will show you its ID
Page: Make sure nothing is selected to get the ID of a page, then press Ctrl+M on Windows or Cmd+M on macOS.
Layer: Select View > Layers from the menu to see the Layers dialog. Click on the three vertical dots (Edit Data) to see the ID of the selected layer.
Click Edit Data in the Layers dialog to see the ID of a selected layer
When you view the diagram is viewed, the custom links are shown as a tooltip when you select the shape with the label Action. When you click on the link, the visible state of the diagram elements are updated and the diagram is saved.
If you are using realtime collaboration, the visible states of the diagram elements are updated in all connected diagrams.
When viewed in the lightbox or in read-only mode, when you click on the shape or text, the visible state of the diagram elements will change, but this change will not be saved.