What is a class diagram
UML class diagram is used to describe the static structure of a system. It can be used for both general conceptual modeling and detailed modeling. Class contains data and behavior, and is an important component of object-oriented.
it is the general name of object sets with the same attributes, operations and relationships. UML class diagrams can also be used for data modeling.
It can be used to describe objects and information structures within an application or with other users.
In UML, problem domains will eventually be transformed step by step, modeling through classes, and building these classes through programming languages. The class and their relationship form a class diagram. The class diagram can also contain elements such as interfaces and packages, as well as instances such as objects and chains.
Symbols in Class Diagram
class
The class is represented by a rectangle and divided into 3 parts by two straight lines, as shown in the figure:

Attribute
The properties section of the class lists each property of the class in a separate row.
The properties section is optional, but when used, it contains each property of the class displayed in a list format.
Each line uses format: name: attribute type (e.g. name: character type).
Operation
Operations are recorded in the bottom area of the class diagram rectangle, which is also optional. Like attributes, class actions are displayed in a list format, with each action on its own line.
Record operations using the following symbols: name (parameter list): type of return value (For example, set name (name parameter): void).
relationship
correlation
Association specifies the “whole/part” relationship between two classes. In the association relationship, the objects of the whole class take some of the objects of the class as instance data. In the class diagram, the association relationship appears as a directed solid line.
Unidirectional association:
In one-way association, the two classes are related, but only one class knows that this relationship exists. One-way associations are drawn as solid lines with open arrows pointing to known classes.

Two-way (standard) association
Is a link between two classes. Association is always considered to be two-way; This means that both classes know each other and their relationship unless you define the association as another type. The solid line between the two classes indicates a bidirectional association.

Diversity
Place multiple symbols at the end of the association. These symbols represent the number of instances of one class linked to one instance of another class.
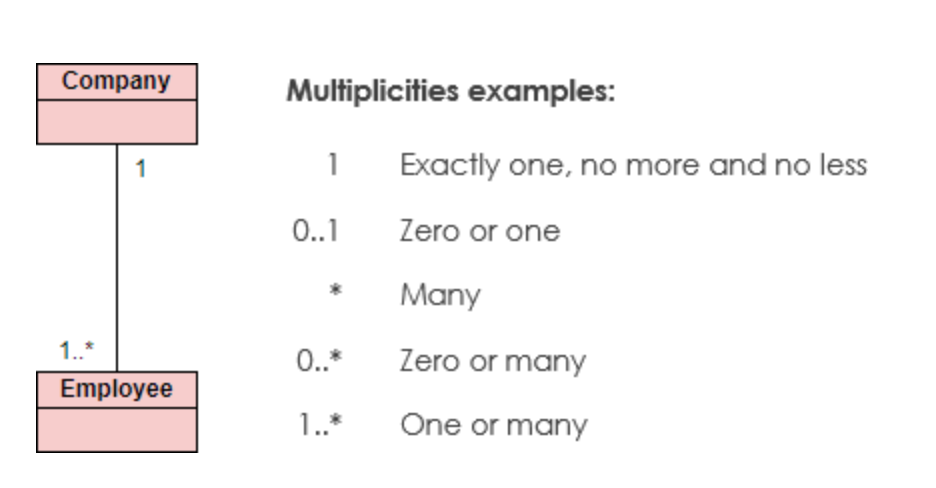
For example, a company will have one or more employees, but each employee only works for one company.
The relationships are as follows:
| Relationship | Description | Graphics: |
|---|---|---|
| 1 | 1to1 | |
| 0..1 | 0 or 1 |
- | many
0..* | 0 or many
1..* | 1 or many
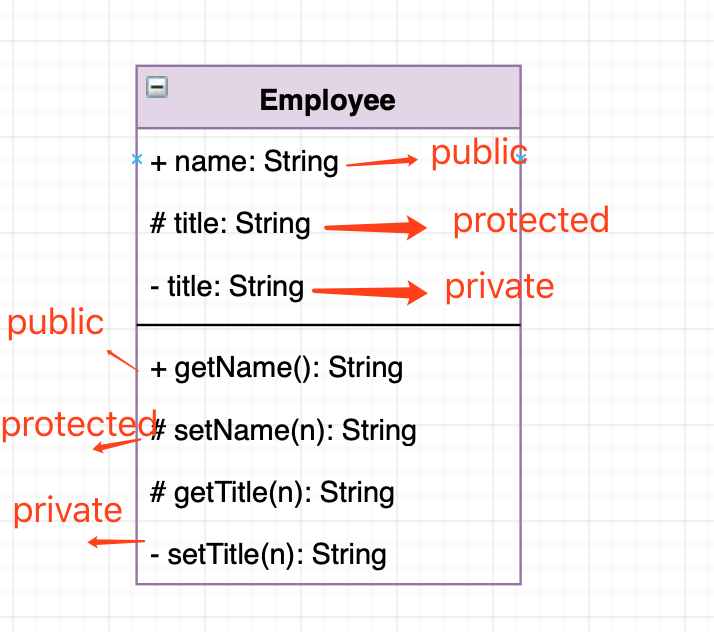
visible
Used to indicate who can access the information contained in the classes represented by+,-,# and ~, as shown in the figure:
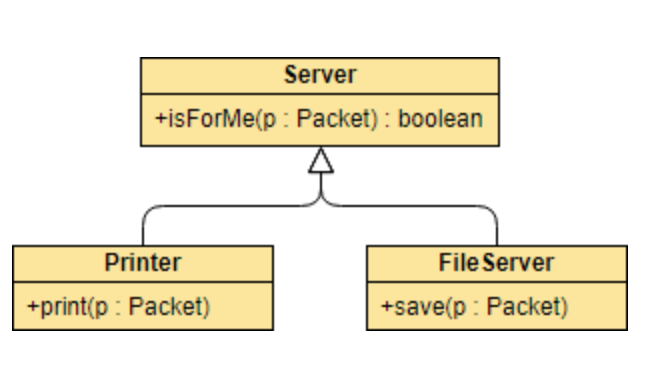
Supper Class
The relationship between superclass and more specific things (called subclasses). Generalization is sometimes called “is a kind of” relation, which is established through inheritance process. In class diagrams, generalized relationships appear as solid lines with large open arrows pointing to parent classes.
Abstract classes and methods
In the inheritance hierarchy, subclasses implement specific details, while parent classes define the framework of their subclasses. The parent class also provides templates for common methods to be implemented by its subclasses.
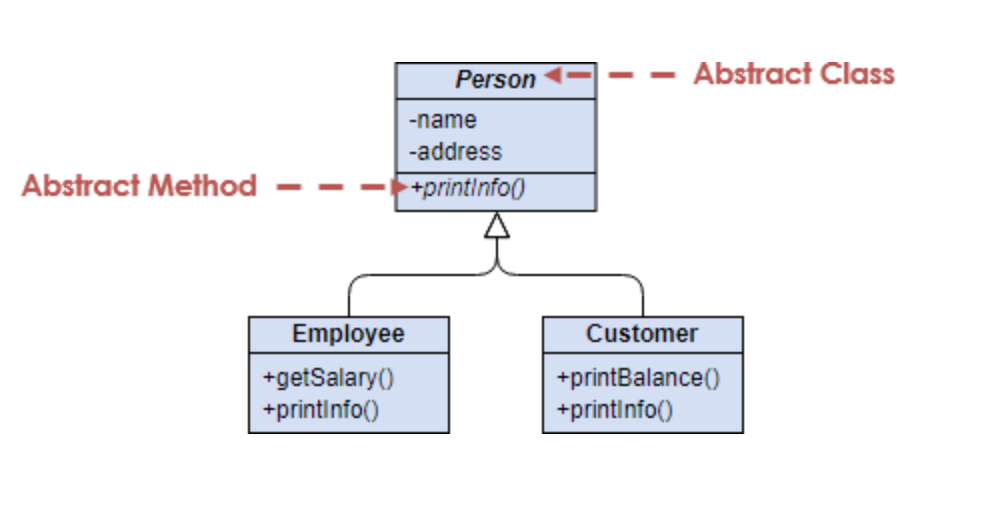
Names of abstract classes are usually displayed in italics; Alternatively, you can use text annotations to display abstract classes, also known as templates {abstract}, after or under its name. Abstract method is an unrealized method. To create an abstract method, create an operation and tilt it.
implement
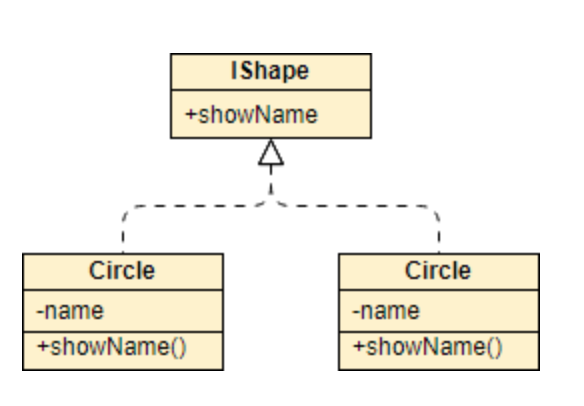
Implementation is the relationship between two things, one thing (interface) specifies a contract, and the other thing (class) guarantees the execution of the contract by implementing the operations specified in the contract.
In the class diagram, the implementation relationship appears as a dashed line with an open arrow pointing to the interface.
rely on
Dependencies represent the “use” relationship between two classes.
In the class diagram, dependencies appear as dashed lines.
If Class A “uses” Class B, one or more of the following statements are generally true: In one or more methods of class a, class b is used as the type of local variable
-Class B is used as a parameter type for one or more methods of Class A.
-Class B is used as the return type for one or more methods of Class A.
-One or more Class A methods call one or more Class B methods

Making Class Diagram
There are many ways to create class diagrams. If you choose to draw the class Tu Tu online, you can use visio or use the online drawing website:
Freedgodesign.
Freedgo Design’s address is https://www.freedgo.com.
Freedgo design Online Drawing website is a multi-type graphics and diagram design software, with rich geometric graphics templates, UML use case diagrams, state diagrams, class diagrams, activity diagrams, sequence diagrams, collaboration diagrams, etc.
It is necessary to decompose business logic into smaller and more specific steps in specific Tu Tu-like. Then, consider any possible exceptions in the class diagram, and if so, add decision nodes for alternative paths.
Continue to repeat the process until you reach a simple step that everyone can fully understand. Now, let’s look at how to use Freedgo Design to make a good class diagram.
step 1:
To visit https://www.freedgo.com, register a user first. After successful registration, log on to Home Page
step2:
Visit https://www.freedgo.com/draw-index.html to enter the Drawing Page or click Start Making from the menu at the top of the Home Page page.
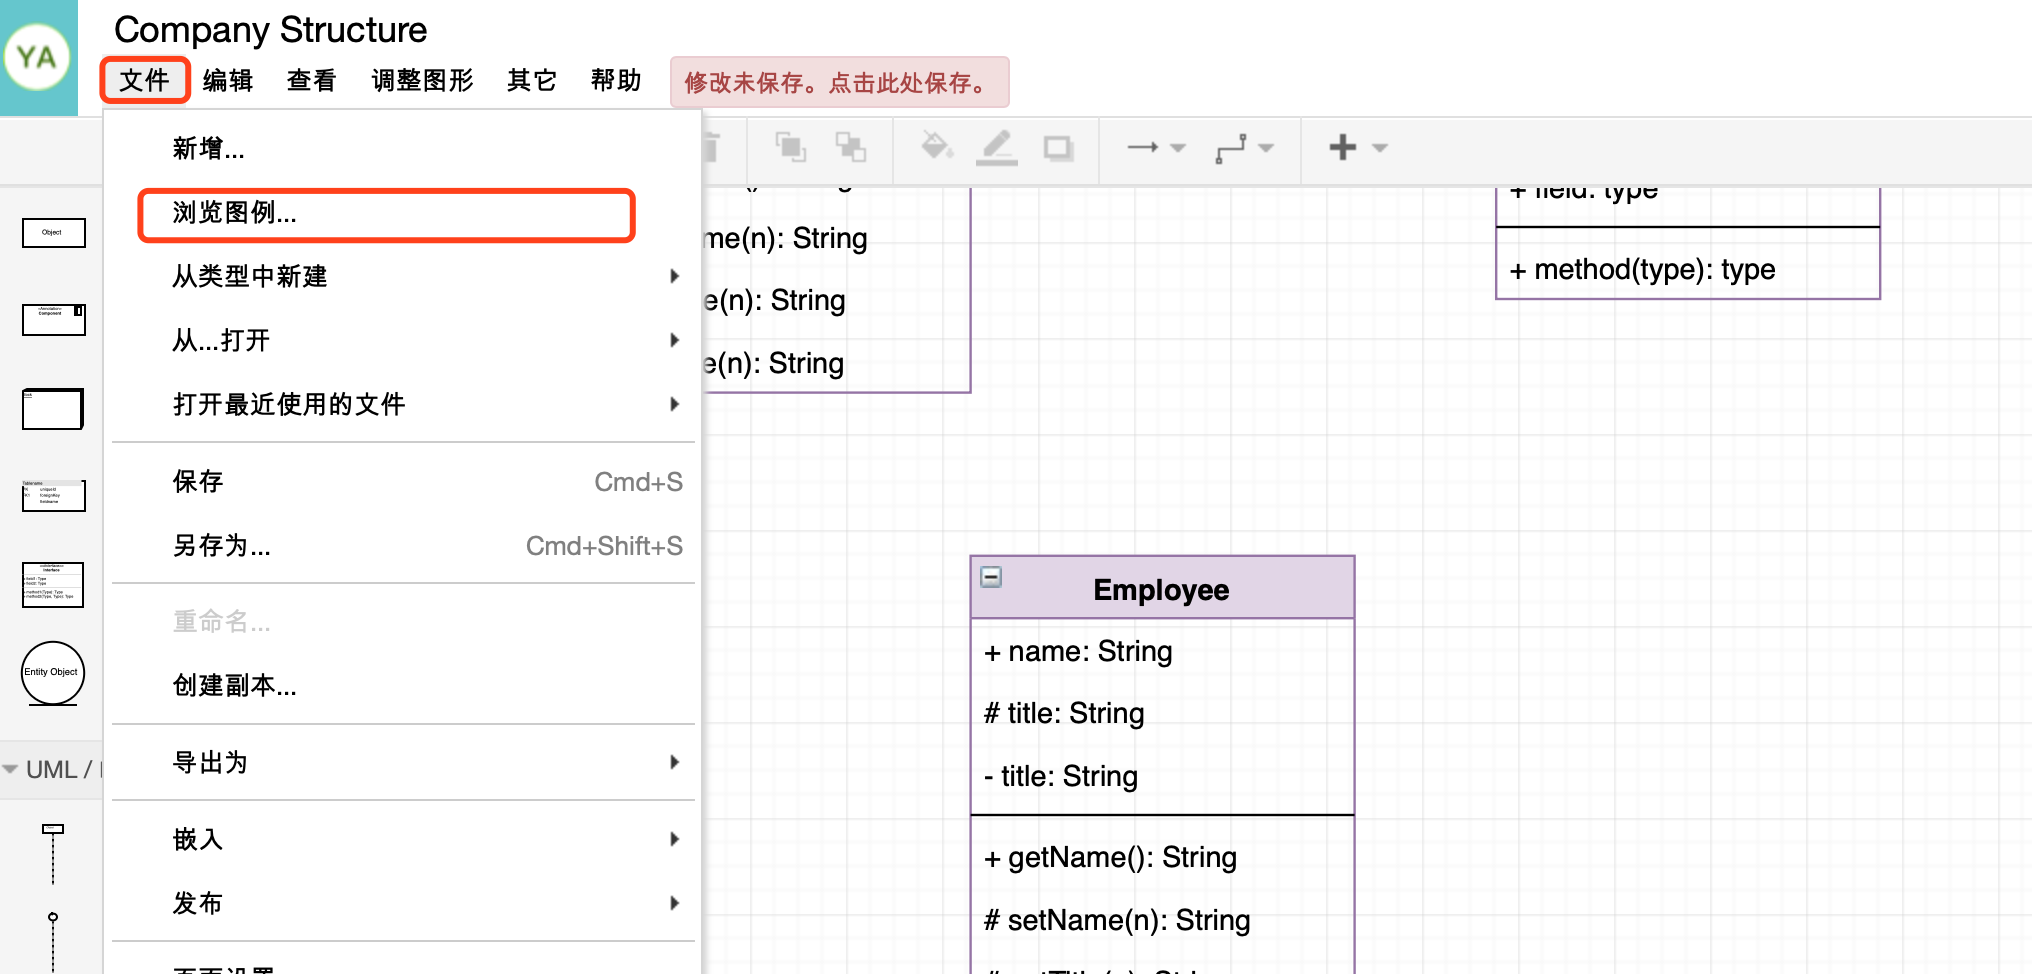
After entering the drawing page, click file-> new from type-> software design-> class diagram

Or click on the legend, find software design-> class diagram in the legend, and select a similar legend to make changes.

step3:
Drag the appropriate geometric figure from the symbol bar on the left to the canvas. After releasing, the figure will be fixed on the canvas.
Double-click the geometric figure and enter text.
When the mouse is placed on the graph, A “small triangle” will be displayed around the graph to facilitate users to quickly generate new graphs after clicking.

step4:
The software provides a variety of connection styles. In this class diagram, you can select an associated connection line.
On the connection line, you can also enter text for further explanation.

step5:
The class diagram making tool has a set of rich styles. Users can fill closed graphics with monochrome, gradient, and text size, position, and color adjustment. After the pattern-filled class diagram, the color value has improved a lot.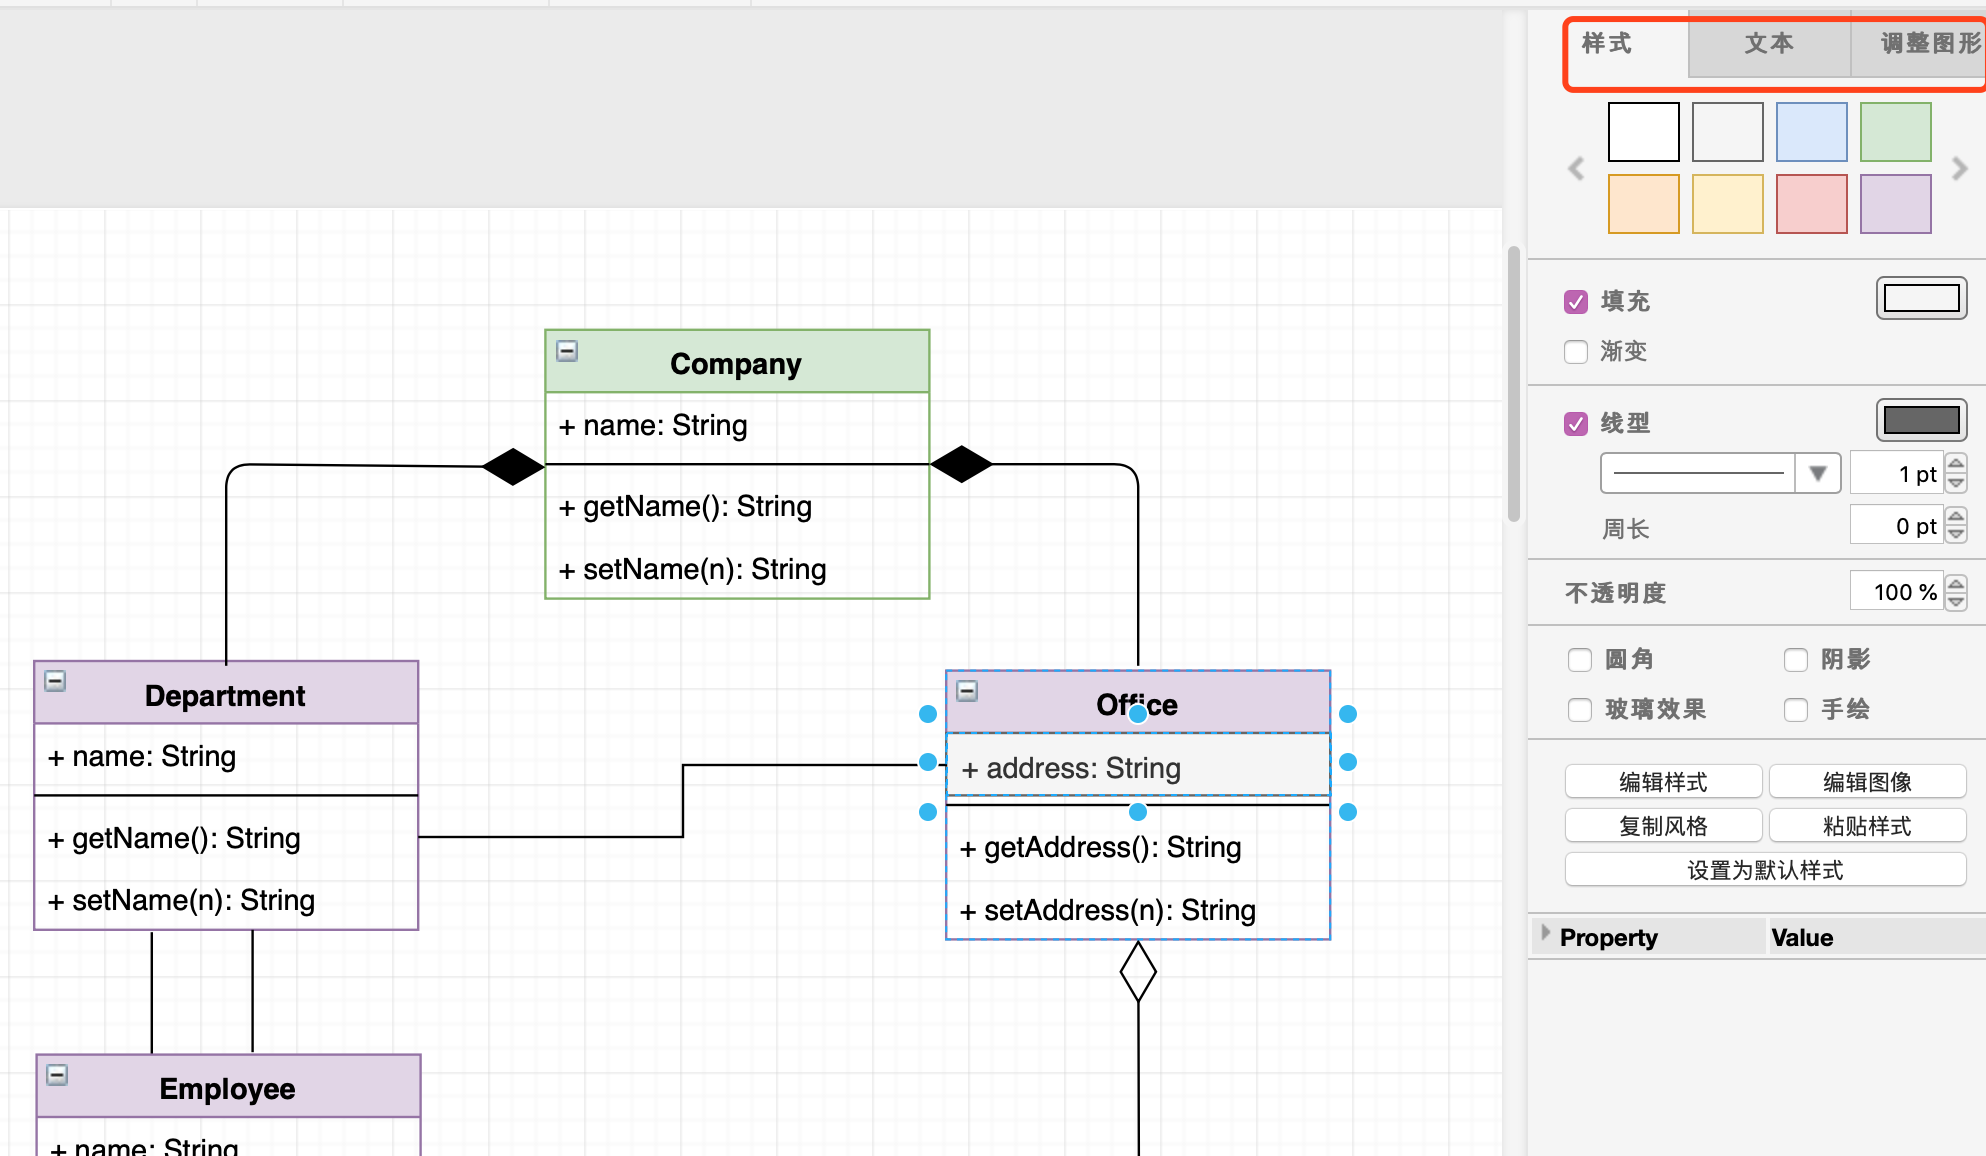
step6:
According to the drawing requirements, the class diagram is drawn step by step. Finally, the whole painting task was completed.
For more examples of basic class diagrams, please refer toexample Or direct access : https://www.freedgo.com/showcase/software_design/ClassDiagram-1.html