Flow Chart
Flowchart is a common diagram in work, mainly composed of lines, geometric borders and text.
According to different functions, the flow chart can be divided into basic flow chart, scattered page flow chart, cross-functional flow chart, data flow chart and event flow chart.
The basic flow chart is one of the most commonly used, which can be used to describe the process of an item or event.
The intuitive chart style is helpful for the readers to understand.
A flow chart is a diagram made up of connection shapes that represent processes or plans.
The following is an example of a simple flow chart to illustrate the process of customer service.

define
Traditionally, flowcharts originated from computer science as tools to represent algorithms and computer programs, but the use of flowcharts has been extended to represent all other types of processes.
Nowadays, flowcharts play an extremely important role in displaying information and assisting reasoning.
They help us visualize complex processes or clarify the structure of problems and tasks.
Flowcharts can also be used to define processes or projects to be implemented.
Common Symbols for Flowcharts
In the standard flow chart, different shapes have different traditional meanings.
Some of the more common shapes have the following meanings:
Start and end nodes
Represents the beginning or end of a system.
start:
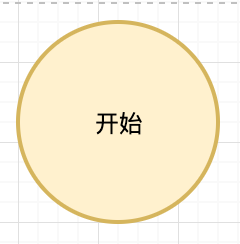
end

process
Represents a specific operation
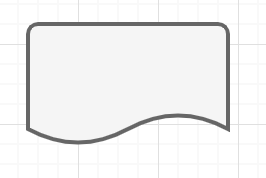
document
Represents some specific output, such as a description or report.
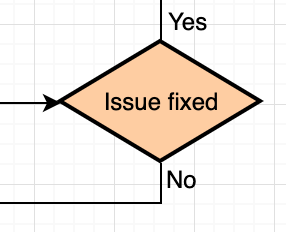
Decision
Rhombs represent conditions or branches. The lines of the branches connected by diamonds represent different possible situations, resulting in different subprocesses.
data
It represents information about entering or leaving the system. Enter an order that may be a customer. The output can be the product to be delivered.

Sub-process & Predefined Process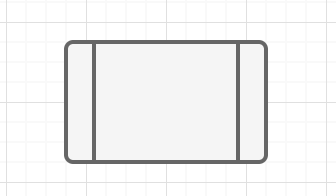
Internal storage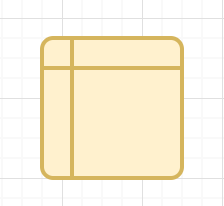
On-Page Reference
There will be a letter in this symbol. It means that the process continues on symbols that contain the same letters on the same page.
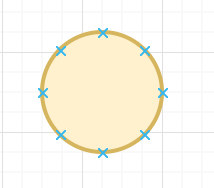
Off-Page Reference
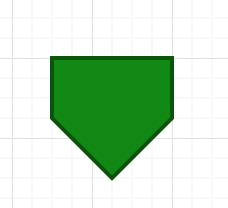
There will be a letter in this symbol. It means that the process continues on matching symbols that contain the same letters elsewhere on different pages.
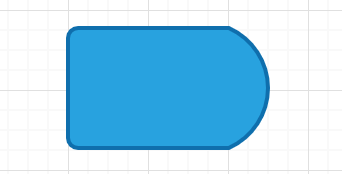
** Delay or Bottleneck**
Identify delays or bottlenecks.
** flow**
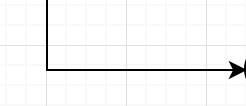
Lines represent the sequence and direction of the process.
Benefits of flow charts
- Show the complexity of the work process, problems, duplication, redundant links and areas that can be simplified and standardized;
- Compare and contrast actual and imagined process flows in order to seek opportunities to improve the process;
- Provides a tool for visually and popularly displaying complex processes
Production of flow chart
There are many ways to create flowcharts.
if you choose to draw flowcharts online, it is recommended to use the online drawing website: freedgodesign. Freedgo Design, whose access address is: https://www.freedgo.com.
Freedgo design online drawing website is a multi-type graphic design software, with rich geometric graphics templates, which can be used to draw professional flowcharts, swimlane charts, impact charts, SDL charts, approval charts, accounting flowcharts, etc.
Business logic needs to be broken down into smaller and more specific steps in a specific flow chart.
Then, consider any possible exceptions in the process, and if so, add decision nodes for alternative paths.
Continue to repeat the process until you reach a simple step that everyone can fully understand.
Now, let’s take a look at how to use Freedgo Design to make a nice flowchart.
step1:
visitor https://www.freedgo.com ,First register a user, and after successful registration, log in to home
step2:
visitor https://www.freedgo.com/draw-index.html ,Enter the drawing page or click “start making” from the menu at the top of the “home page” page.
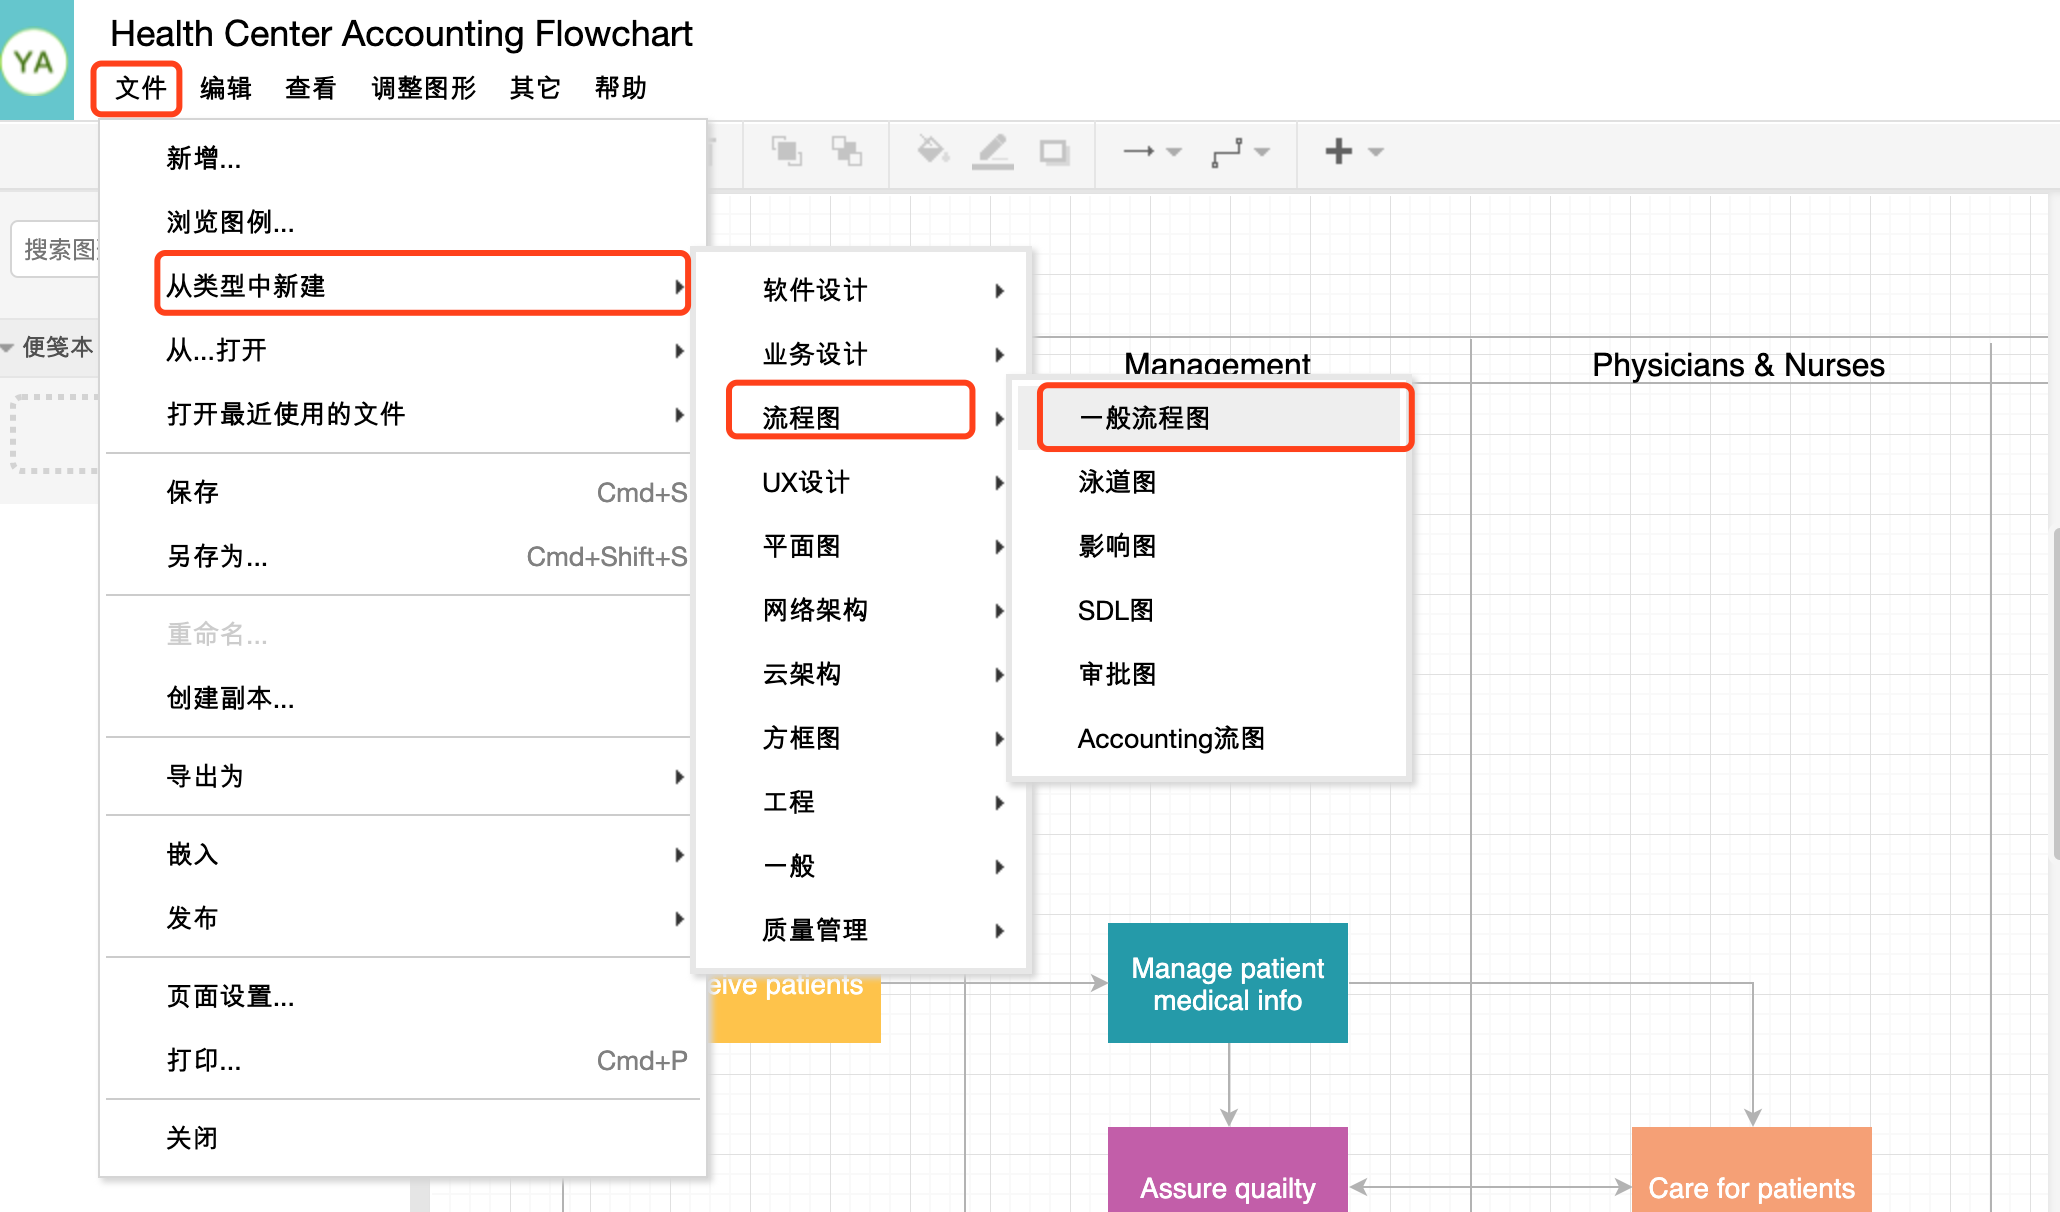
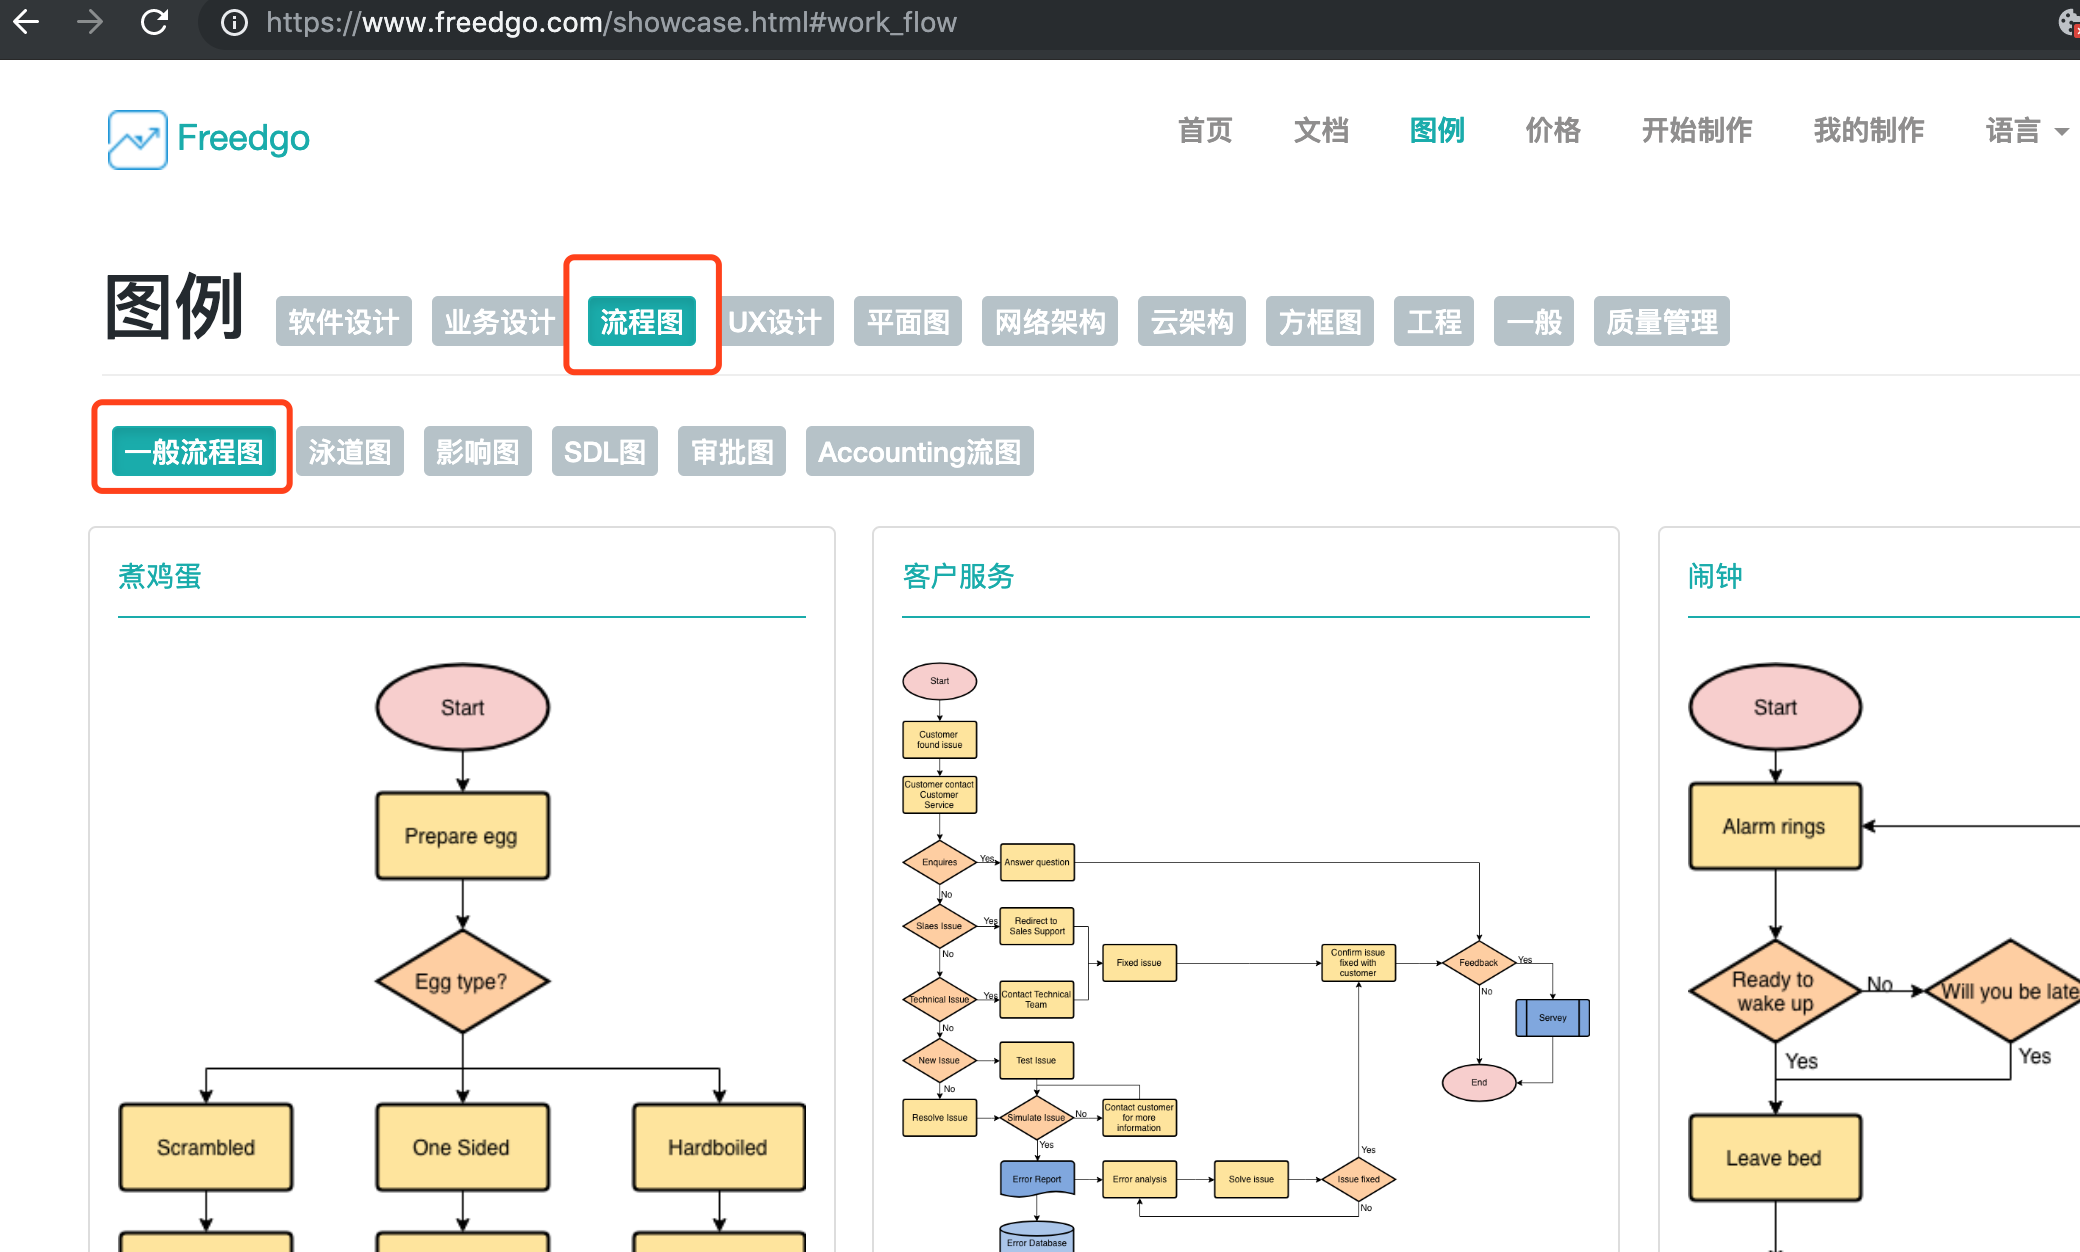
After entering the drawing page, click file-> new from type-> flowchart-> general flowchart.
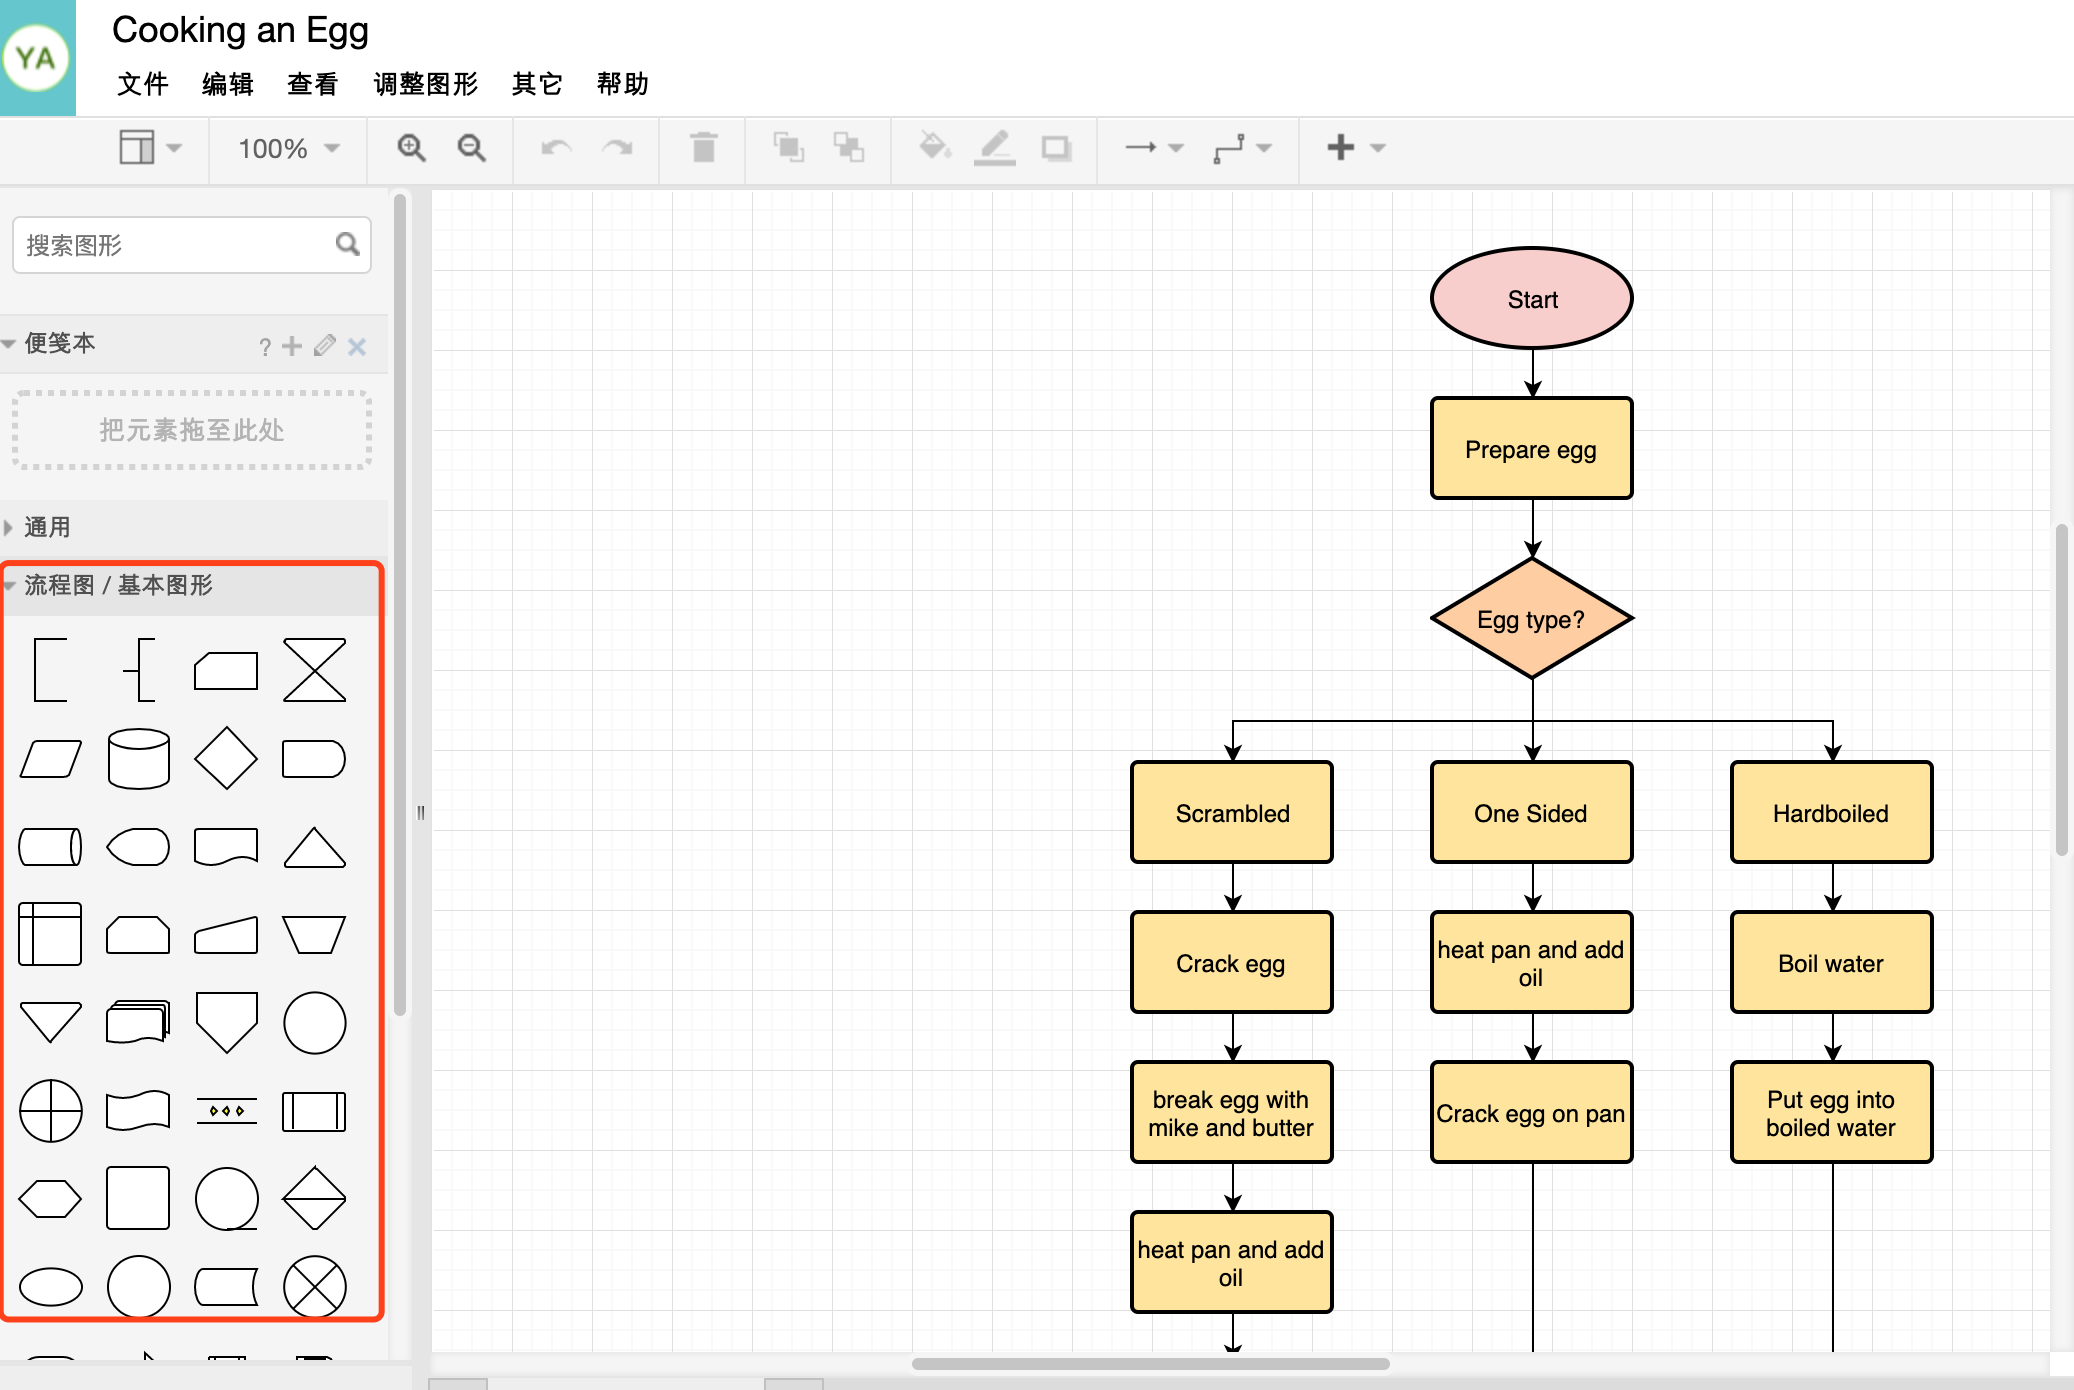
Or click on the legend, find the “flowchart”-> “basic flowchart” in the legend, and select a similar legend to change it.

step3:
Drag the appropriate geometric figure from the symbol bar on the left to the canvas. After releasing, the oval figure will be fixed on the canvas. Double-click the geometric figure and enter text. When the mouse is placed on the graph, A “small triangle” will be displayed around the graph to facilitate users to quickly generate new graphs after clicking.
step4:
The software provides a variety of connection styles. In this flow chart, you can select common right-angle connection lines. On the connection line, you can also enter text for further explanation.
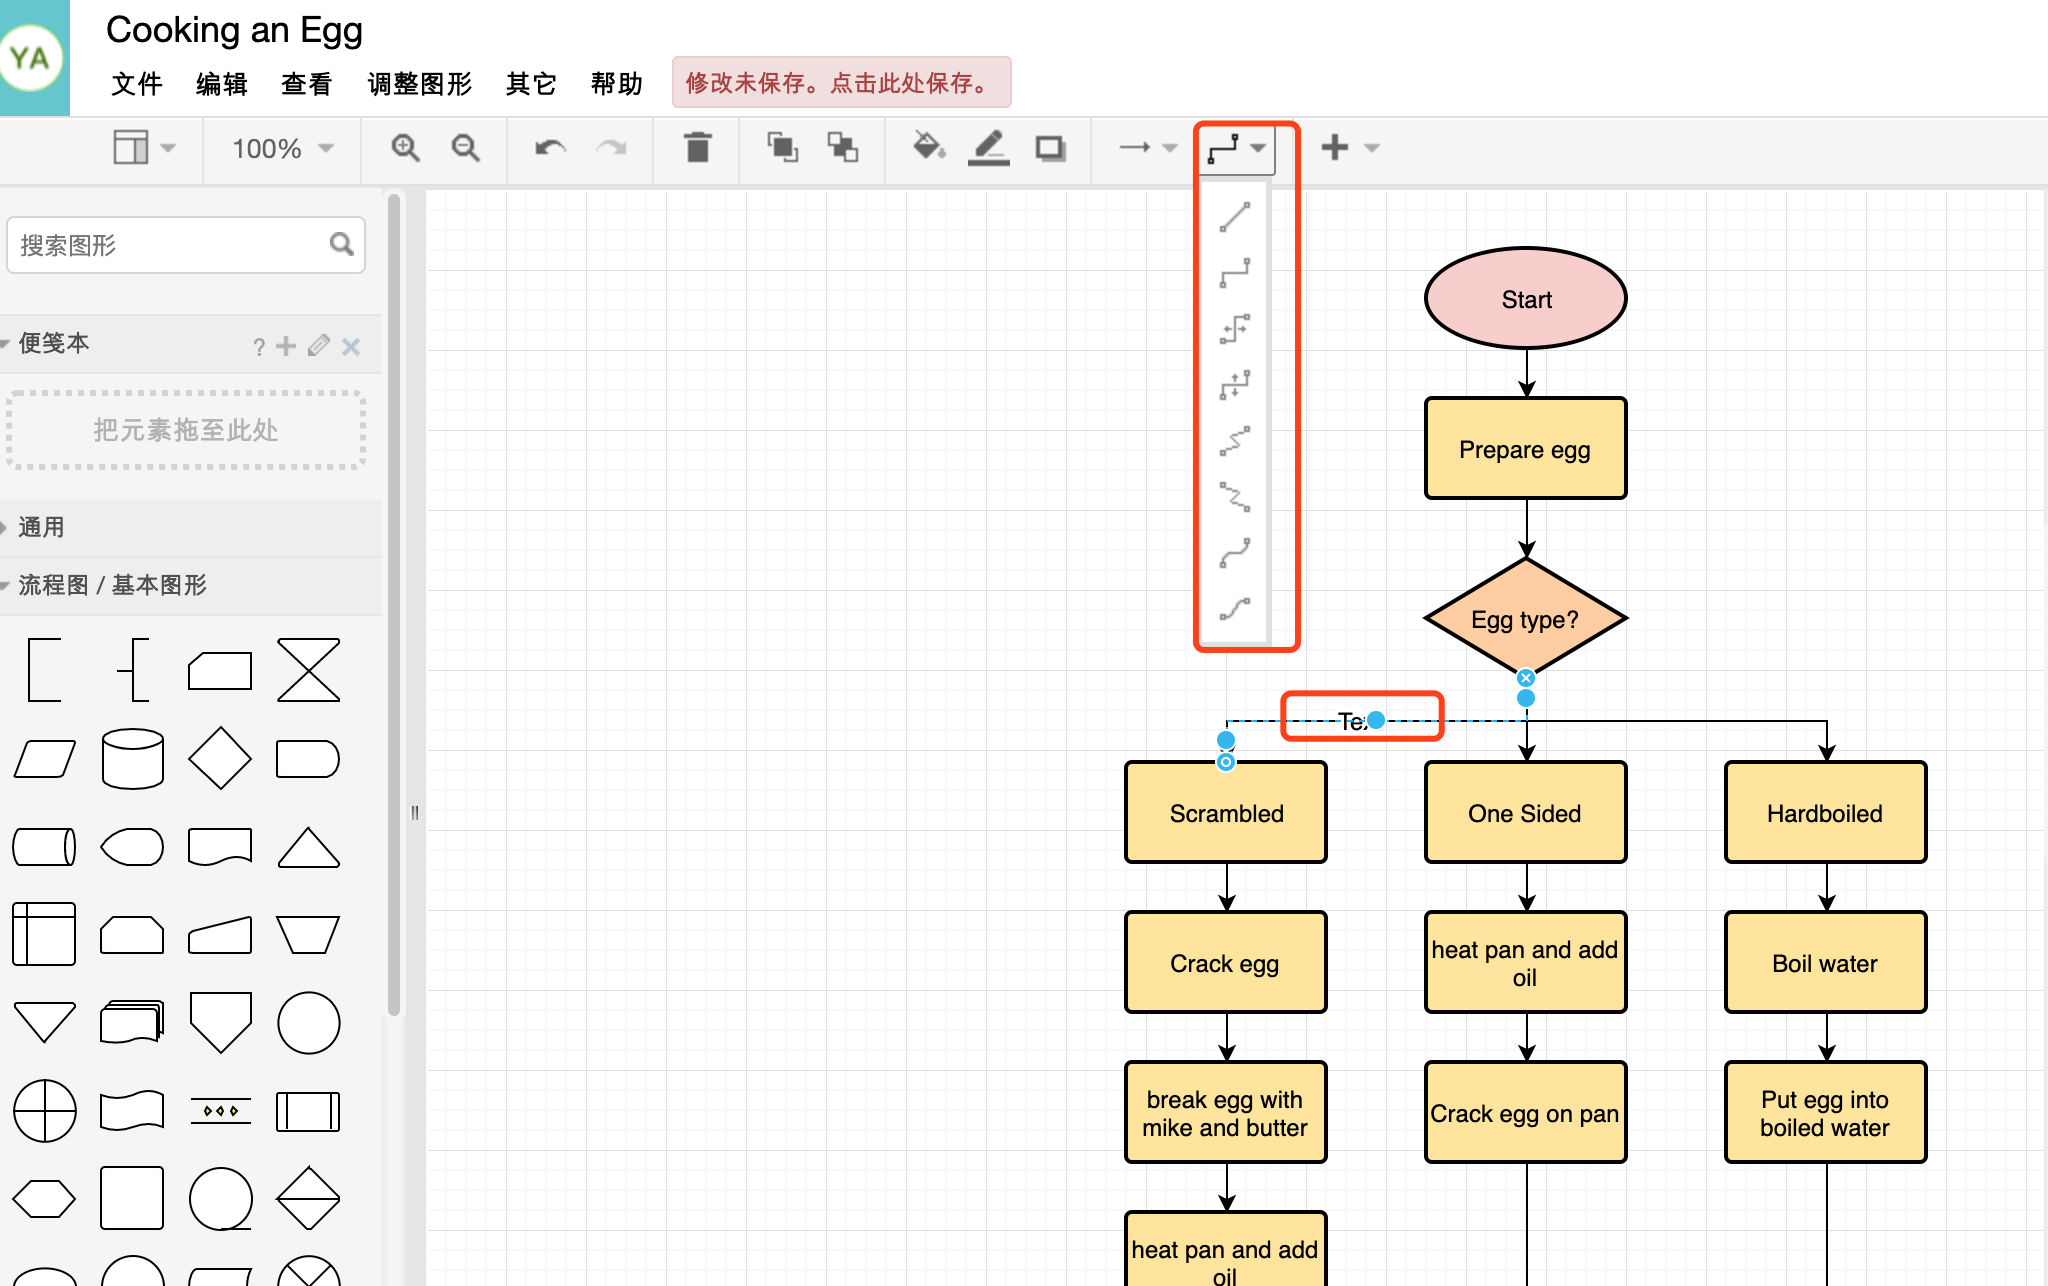
step5:
The flow chart making tool has a set of styles with rich functions. Users can fill closed graphics with monochrome, gradient, text size, position and color adjustment. After the flow chart of pattern filling, the color value has been greatly improved.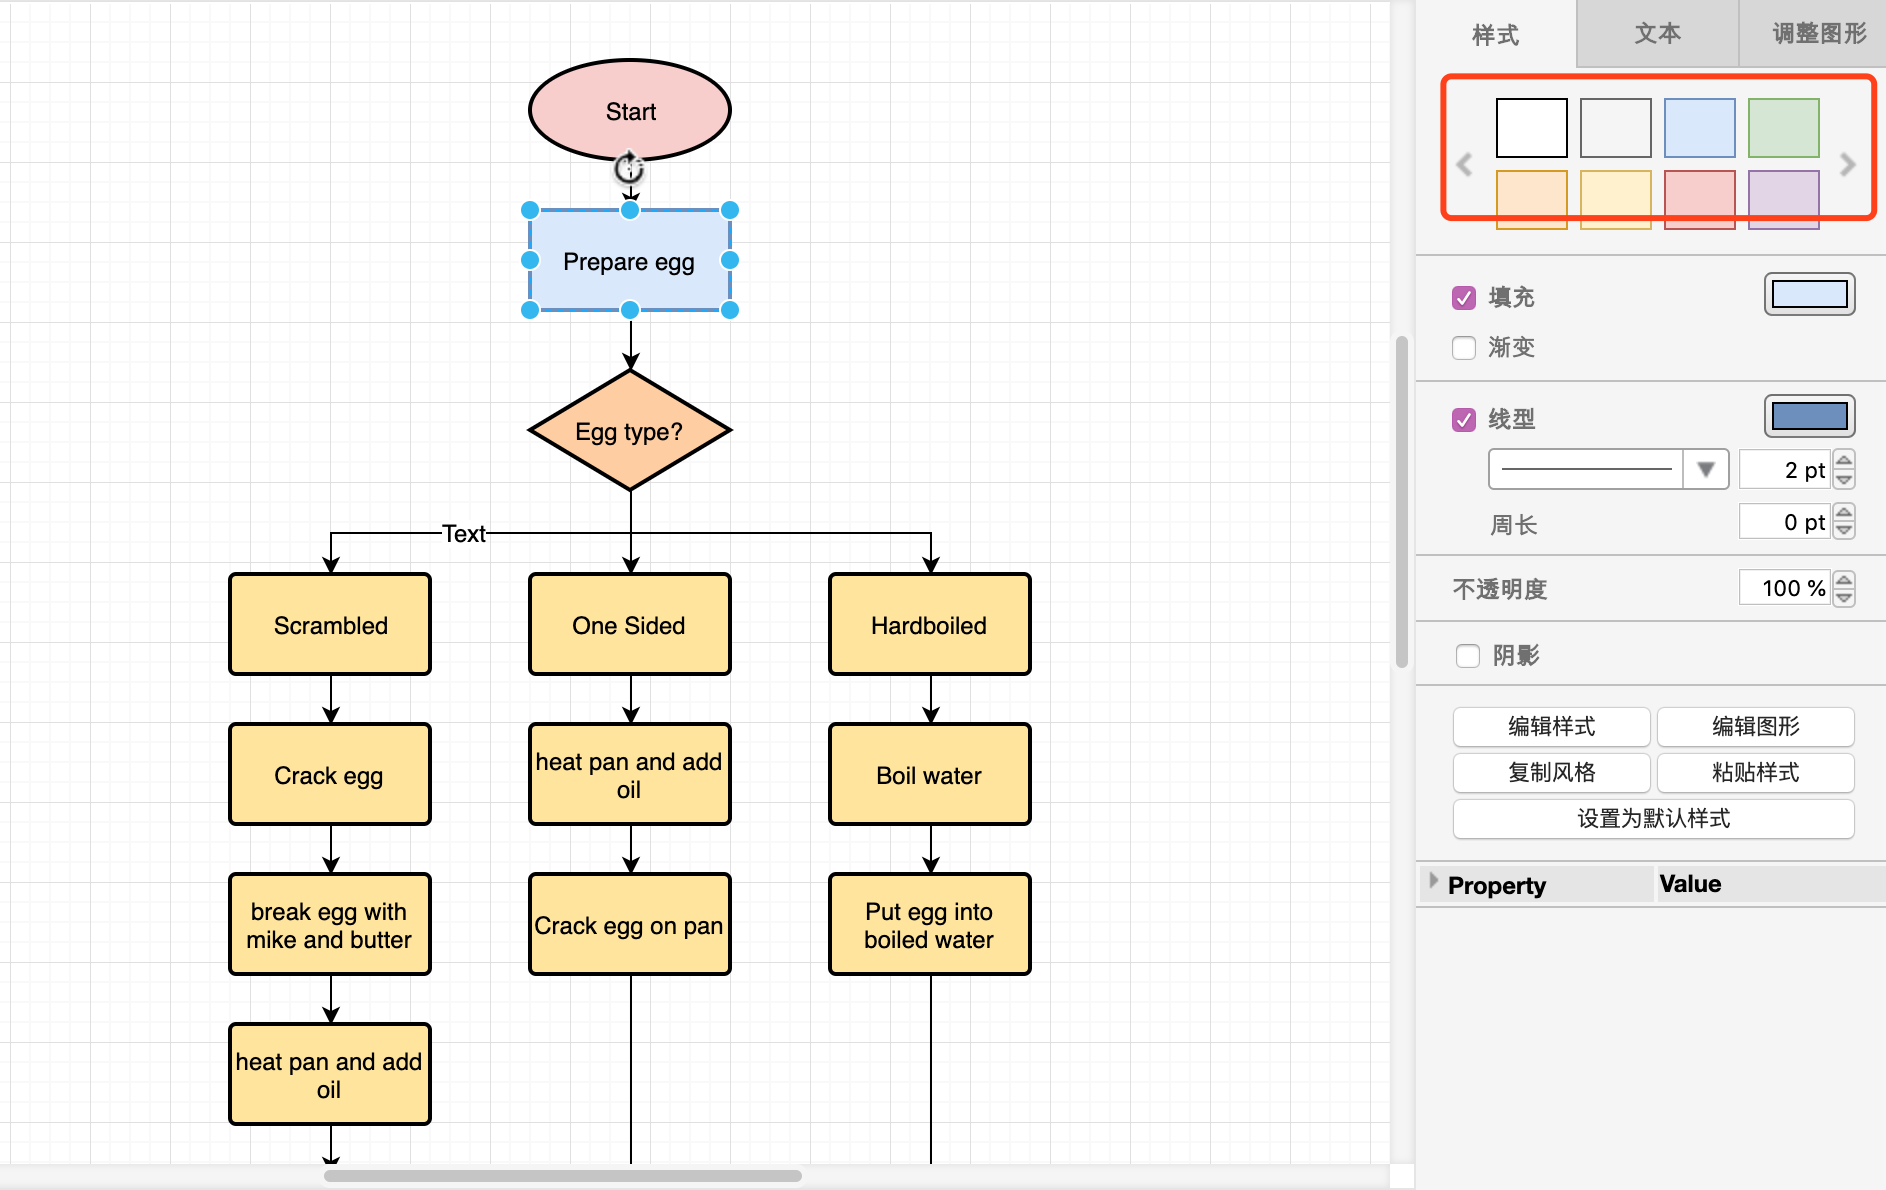
step6:
According to the drawing requirements, the flow chart is drawn step by step. Finally, the whole painting task was completed.
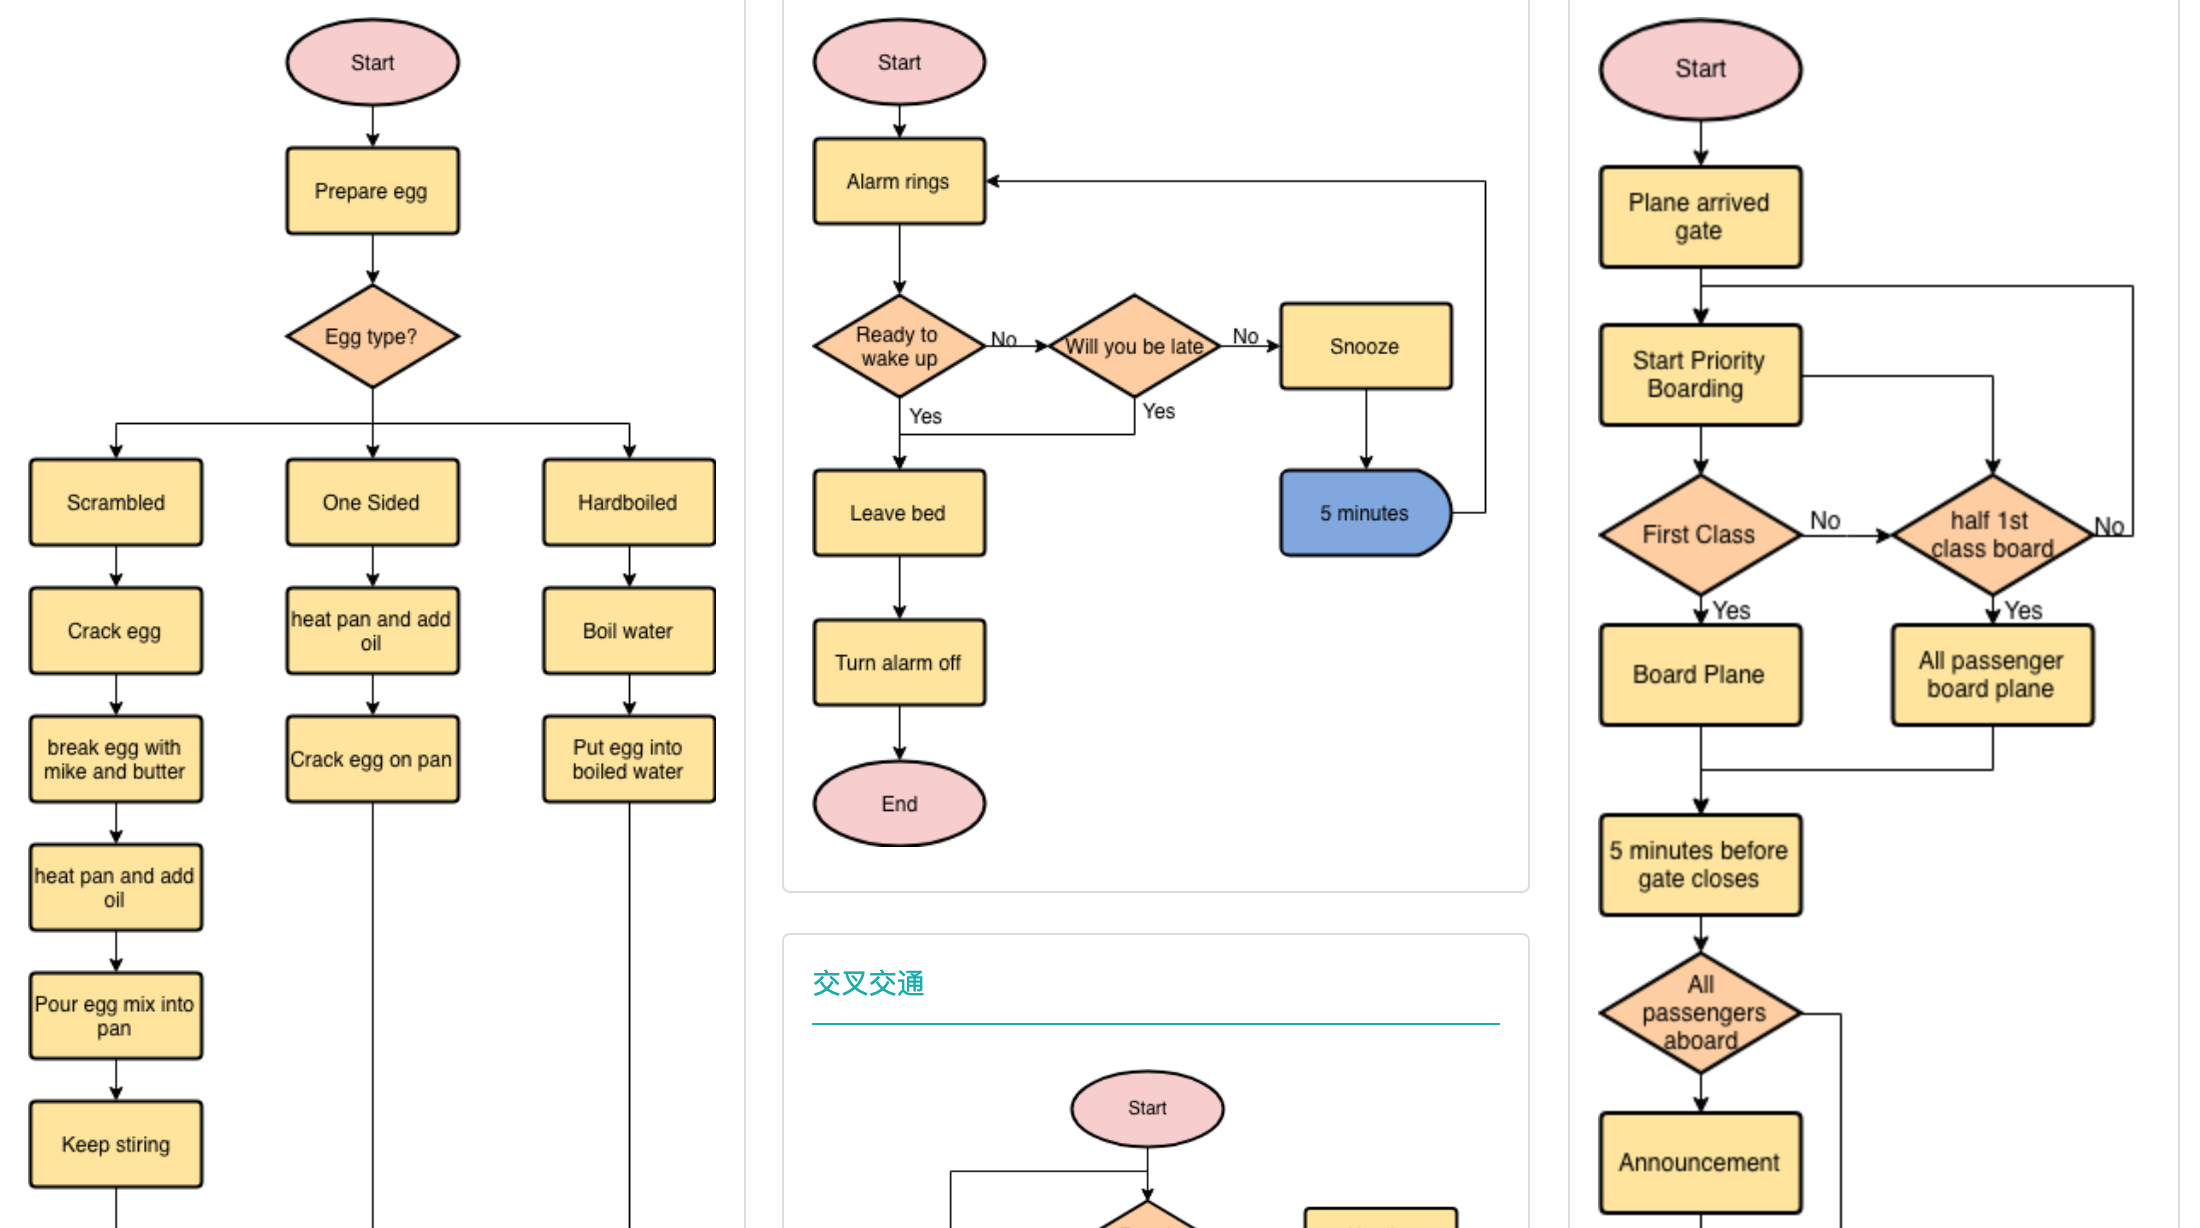
For more examples of basic processes, please refer to example Or direct access : https://www.freedgo.com/showcase/network_diagram/NetworkDiagram-1.html